
In the world of digital business, sustainable growth is not the result of luck or a single viral campaign. It is achieved through a systematic, data-driven approach to understanding the entire customer journey. This is where the AARRR framework comes in. More than just an acronym, it is a powerful model that helps startups, SaaS companies, and digital marketers focus on the metrics that truly matter. It provides a clear roadmap for converting strangers into customers, and customers into vocal advocates for your brand.
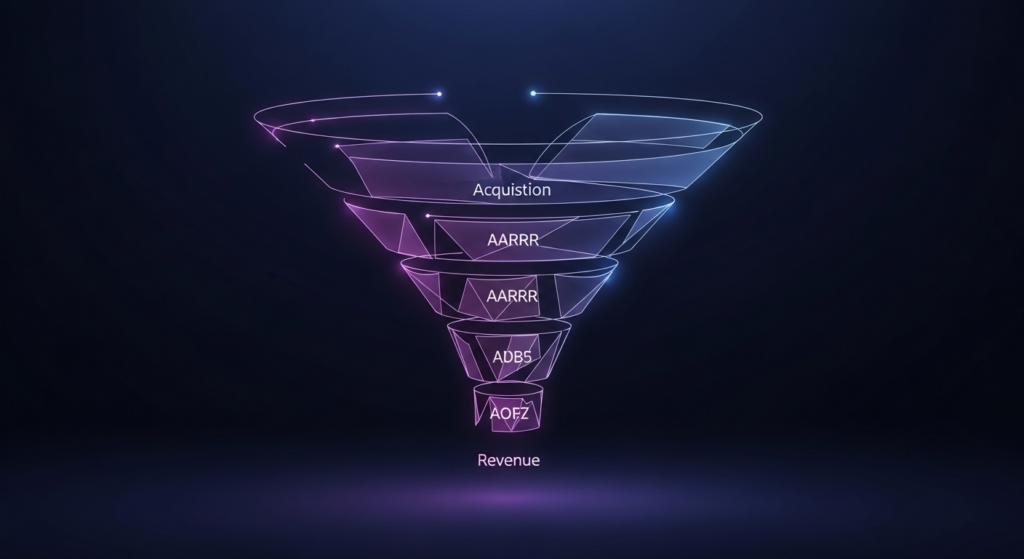
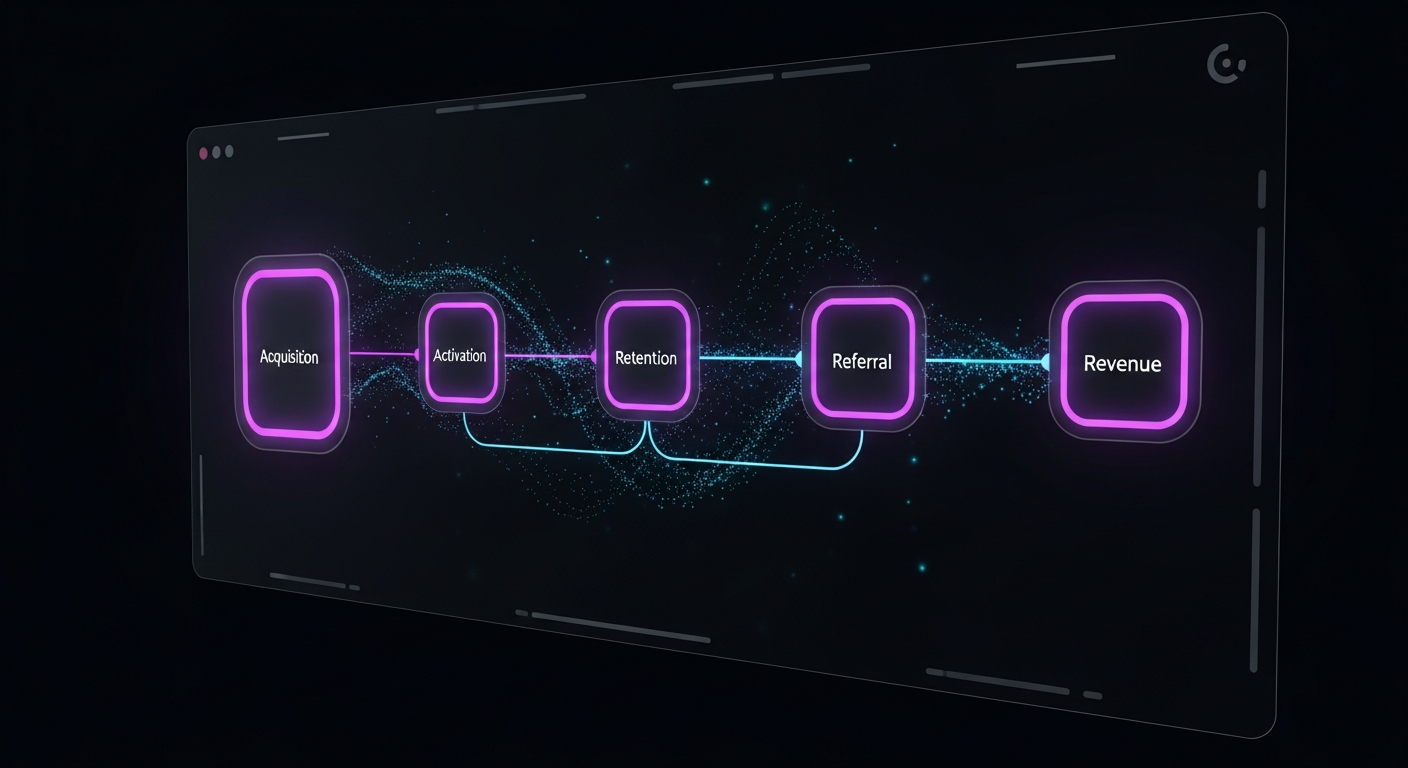
This guide provides a comprehensive overview of the AARRR funnel, famously known as ‘Pirate Metrics.’ We will dissect each of the five stages—Acquisition, Activation, Retention, Referral, and Revenue—exploring the key metrics, strategies, and tools necessary to implement this framework effectively. Whether you’re a founder seeking product-market fit or a marketer looking to optimize your funnel, mastering AARRR will equip you with the insights needed to build a robust engine for sustainable growth.

The AARRR framework is a five-stage model for understanding and optimizing the customer lifecycle. The framework was designed to steer businesses away from superficial ‘vanity metrics’ toward a sequence of actionable data points that directly correlate with growth. It maps the user journey from the first point of contact to the ultimate goals of generating revenue and creating brand advocates. Each stage represents a critical conversion point that can be measured, analyzed, and improved.
The AARRR framework was created by venture capitalist and 500 Startups founder Dave McClure in 2007. At the time, the Lean Startup methodology was gaining traction, emphasizing rapid iteration, validated learning, and data-driven decision-making. McClure developed AARRR as a practical tool for the startups he invested in, giving them a simple yet powerful way to diagnose their business health. Instead of getting lost in complex financial models or overwhelming dashboards, founders could use these five metrics to pinpoint the weakest link in their customer funnel and focus their limited resources on fixing it.
One of the core principles behind AARRR is the rejection of vanity metrics. These are numbers that look impressive on the surface but do not translate to business success—think raw page views, social media followers, or total app downloads. While these figures might feel good, they do not reveal if users are engaged, getting value from your product, or paying for it. AARRR forces a shift in focus to actionable metrics. For example, instead of tracking total signups (a vanity metric), you track the percentage of users who complete a key action after signing up (an Activation metric). This focus on user behavior and its connection to revenue is what makes the framework so powerful for genuine growth.
The framework gets its memorable nickname, ‘Pirate Metrics,’ because when the acronym (A-A-R-R-R) is said aloud, it sounds like a pirate’s growl. This catchy name helped it spread throughout the startup community. The five stages are:

Acquisition is the top of your funnel. It encompasses all the activities you undertake to attract potential customers and drive them to your digital properties, whether that’s a website, a landing page, or an app store listing. This stage is about generating awareness and traffic, but more importantly, it’s about attracting the *right* kind of traffic—users who are likely to find value in your product and eventually become paying customers. Without a steady stream of qualified leads entering the funnel, the subsequent stages are ineffective.
Users do not just appear; they arrive through specific channels. It is crucial to identify and track the performance of each one to understand where your most valuable customers are coming from. Common acquisition channels include:
To measure the effectiveness of your acquisition efforts, you need to track specific metrics for each channel:
Optimizing acquisition is not just about getting more traffic; it’s about becoming more efficient. The goal is to lower your CAC while increasing the quality of the users you attract. Effective strategies include:

Acquiring a user is only the first step. If a user signs up but is met with a confusing, overwhelming, or valueless experience, they will likely leave and never return. Activation is the critical stage where a new user experiences the core value of your product for the first time. It is about engineering the ‘Aha!’ moment as quickly and smoothly as possible, transforming a curious visitor into an engaged user who understands what your product can do for them.
The ‘Aha!’ moment is the point at which a user internalizes the value proposition of your product. It’s the realization of, “Wow, this is what this product is for, and it’s great!” This moment is different for every product. For example:
To optimize activation, you must first define this moment for your product by analyzing the behavior of your most retained users.
Once you have defined your ‘Aha!’ moment, you can measure it. The Activation Rate is the percentage of new users who complete this key event (or series of events) within a specific timeframe, such as the first seven days. For example, if 1,000 users sign up in a week and 250 of them create and share a document (your key activation event), your weekly activation rate is 25%. Tracking this metric is far more insightful than tracking total signups, as it measures how effectively you are delivering on your initial promise.
The path to the ‘Aha!’ moment is paved by a great user onboarding experience. The goal is to guide the user to value with minimal friction. Proven tactics include:

Retention is the foundation of sustainable growth. It is the measure of how many users return to your product over time. Many startups fall into the trap of focusing obsessively on acquisition, constantly pouring new users into the top of the funnel. However, if the product is a ‘leaky bucket’ where users fail to find value and quickly leave, that acquisition spending is wasted. High retention, on the other hand, creates compounding growth, increases customer lifetime value, and provides a stable base of users who can be monetized and turned into advocates.
Simply put, it is far more expensive to acquire a new customer than it is to keep an existing one. Research by Bain & Company has shown that increasing customer retention rates by just 5% can increase profits by 25% to 95%. Retained customers are more likely to upgrade their plans, buy additional services, and provide valuable feedback. They are the users who truly understand your product’s value, and they form the core of your business. A business with high churn is constantly struggling to replace lost customers just to stay afloat, while a business with high retention can focus its resources on expansion and innovation.
To understand your product’s stickiness, you must track two vital metrics:
Improving retention requires a proactive approach to delivering continuous value and building a strong relationship with your users.

Referral is the stage where your growth engine can truly accelerate. It is about turning your happy, retained customers into a powerful, organic acquisition channel. When a user loves your product so much that they willingly tell their friends, colleagues, or social media followers about it, they are providing you with the most valuable form of marketing: word-of-mouth. A referral is more than just a lead; it is a warm introduction that brings built-in trust and social proof, often leading to higher conversion rates and lower acquisition costs.
Word-of-mouth has always been a powerful driver of business, but in the digital age, its potential is amplified. A single recommendation can reach hundreds or thousands of people through social networks and review sites. The key to unlocking this potential is to first create a product experience that is genuinely remarkable. People share things that make them look smart, save them time, or deliver exceptional value. Before you build a complex referral program, you must ensure you have a product worth talking about. The Referral stage is a direct outcome of success in the Activation and Retention stages.
To systematically improve referrals, you need to measure your users’ willingness to share.
While some word-of-mouth happens organically, a structured referral program can accelerate the process. Best practices include:

Revenue is the ultimate destination for every user flowing through the AARRR funnel. It is the stage where the value you have created and delivered is converted into tangible financial results. While listed last in the acronym, revenue is the driving purpose behind all preceding stages. A business cannot survive without revenue, and this part of the framework focuses on measuring and optimizing the monetization of your user base. It’s about understanding which behaviors and user segments drive the most income and how to increase that value over time.
A healthy AARRR funnel directly translates to a healthy bottom line. High acquisition of qualified leads, strong activation rates, excellent retention, and a steady stream of referrals all create a large, engaged user base that is primed for monetization. The Revenue stage is where you analyze the financial impact of your efforts. For example, you might discover that users acquired through organic search have a 20% higher LTV than those acquired through paid social ads, allowing you to reallocate your marketing budget for greater profitability.
Tracking revenue requires a specific set of metrics, especially for SaaS and subscription businesses:
Increasing revenue isn’t just about getting more customers; it’s about maximizing the value from the customers you have. Key strategies include:
Understanding the AARRR framework is one thing; successfully implementing it is another. It requires a systematic approach, the right tools, and a company culture that embraces data and experimentation. Turning the model into a day-to-day operational reality involves identifying your key metrics, setting up your analytics stack, and empowering your team to act on the insights you uncover.
To avoid being overwhelmed by data, identify one key metric for each stage of the funnel. This ‘One Metric That Matters’ (OMTM) is the single data point you believe will have the biggest impact on growth at your current stage. This focus brings clarity and aligns the entire team.
Your OMTMs will change over time. An early-stage startup might focus heavily on Activation and Retention, while a more mature company might shift its focus to Referral and Revenue optimization.
You cannot manage what you do not measure. A robust analytics stack is essential for tracking your AARRR metrics. You do not need a dozen expensive tools to start, but you do need coverage across the funnel.
The AARRR framework is not a static report; it’s a dynamic tool for driving growth. This requires a culture of experimentation rooted in the scientific method. The process, often called a ‘growth loop,’ looks like this:
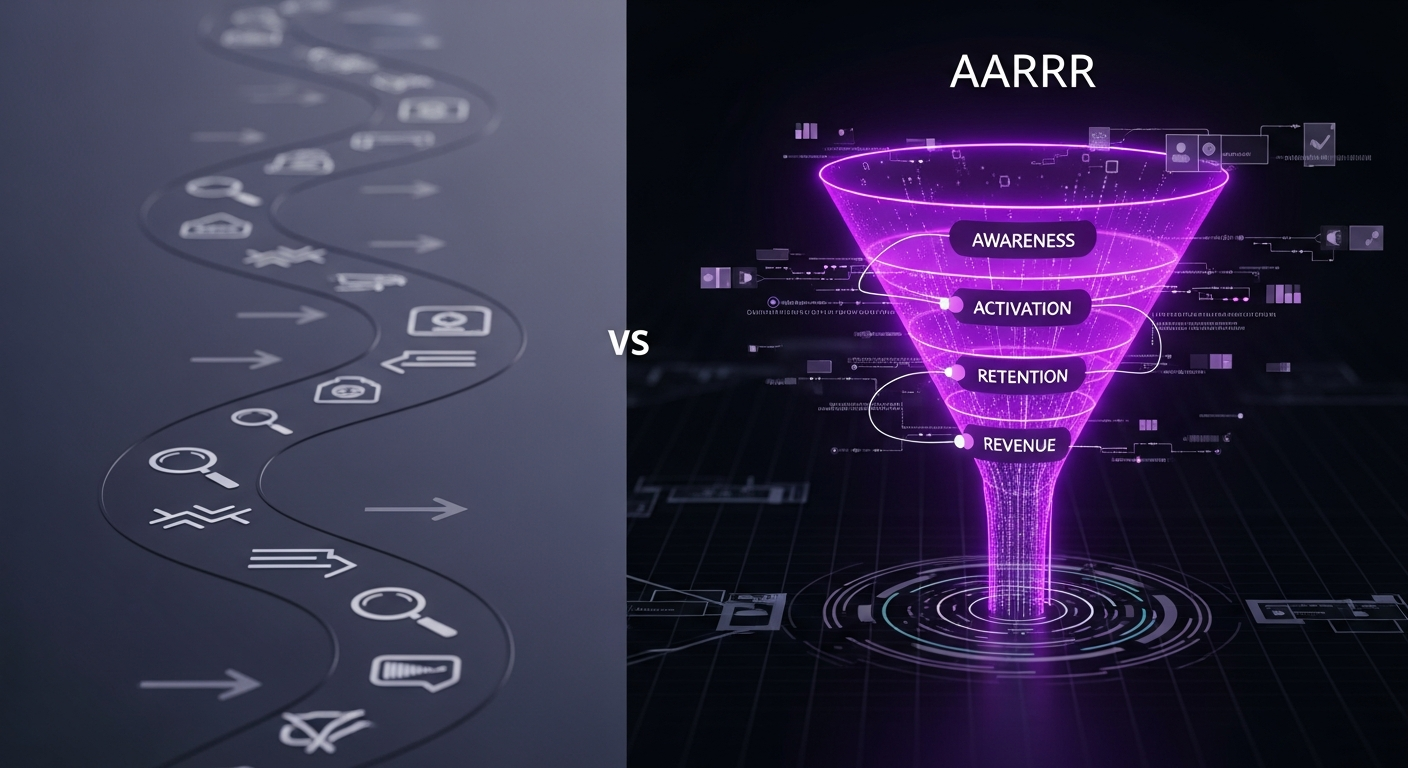
While AARRR might seem like just another funnel, it represents a significant evolution from traditional models like AIDA (Attention, Interest, Desire, Action). The differences are fundamental and highlight why AARRR is so well-suited for modern digital businesses, particularly in the SaaS space.
The most significant difference is the scope. The AIDA model, which originated in the late 19th century, focuses on the pre-purchase journey and ends with the ‘Action’ of a sale. It is primarily concerned with pre-transaction customer psychology. AARRR, however, extends far beyond the initial purchase to cover the entire customer lifecycle. It recognizes that the journey doesn’t end with a credit card swipe; for a subscription business, that is just the beginning. The inclusion of Retention and Referral acknowledges that post-purchase behavior is a critical driver of long-term, sustainable growth.
AARRR is inherently quantitative. Each stage is defined by a set of hard, measurable metrics (CAC, Activation Rate, Churn, NPS, MRR). This makes it a highly accountable framework for growth teams. Traditional funnels like AIDA are often more conceptual and qualitative, focusing on psychological states like ‘Interest’ and ‘Desire,’ which are harder to measure directly. AARRR forces teams to operate with data, not just intuition.
AARRR was born in the digital era and is tailor-made for businesses where user behavior can be tracked with precision. For a SaaS product, you can see exactly when a user logs in, which features they use, and when they stop engaging. This level of granular data makes it possible to accurately measure and optimize each stage of the AARRR funnel. While traditional funnels are still relevant for brand advertising or physical retail, AARRR provides a much more practical and actionable model for software and digital service companies.
| Feature | AARRR Framework | AIDA Model |
|---|---|---|
| Scope | Full customer lifecycle (pre- and post-purchase) | Pre-purchase only (ends at the sale) |
| Focus | Actionable, quantitative user behavior metrics | Qualitative, psychological states of the buyer |
| Key Stages | Acquisition, Activation, Retention, Referral, Revenue | Attention, Interest, Desire, Action |
| Primary Goal | Sustainable, compounding growth | Generating a single transaction or sale |
| Best For | SaaS, mobile apps, subscription services, digital products | Traditional advertising, brand marketing, direct sales |
The AARRR framework is a powerful tool, but it is not foolproof. Teams can fall into several common traps that limit its effectiveness. Being aware of these pitfalls can help you implement the model correctly and derive maximum value from it.
Metrics reveal *what* is happening, but they rarely explain *why*. A common mistake is to become so focused on quantitative data that the human experience behind the numbers is ignored. If your activation rate drops, your dashboard will show it, but it won’t explain that users are getting stuck because the UI is confusing. You must supplement your quantitative data with qualitative insights from user interviews, surveys, support tickets, and usability tests. This combination of ‘what’ and ‘why’ is where the most powerful growth strategies are born.
It is easy to become fixated on a single metric, especially at the top of the funnel. A marketing team might be incentivized solely on hitting an acquisition target, so they spend their entire budget driving traffic. But if the product has a poor activation rate and high churn, they are simply pouring water into a leaky bucket. The AARRR funnel is an interconnected system. A bottleneck in one stage affects all the others. A holistic approach is required, with teams working cross-functionally to optimize the entire customer journey, not just their individual piece of it.
When starting with AARRR, teams often look for external benchmarks. “What’s a good churn rate for a B2B SaaS company?” While these can provide a general sense of direction, they can also be misleading and demoralizing. Every business is unique, with a different price point, target audience, and value proposition. Comparing your seed-stage startup’s metrics to those of a public company like Salesforce is an exercise in futility. The most important benchmark is your own past performance. Focus on continuous, incremental improvement—beating your own numbers week over week and month over month.
As the digital landscape evolves, so do the frameworks used to navigate it. While AARRR remains a foundational model, some growth experts have proposed an alternative sequence: RARRA. This isn’t a replacement for AARRR but rather a re-prioritization of its stages, placing a stronger initial emphasis on keeping the users you already have.
The logic behind RARRA is straightforward: scaling acquisition is ineffective if the product cannot retain users. In today’s hyper-competitive markets, where customer acquisition costs are steadily rising, retention has become more critical than ever. The RARRA model argues that a startup’s first priority should be to build a product that users love and stick with. Only after you have validated your product’s value and stickiness (i.e., achieved a high retention rate) should you focus on scaling the other parts of the funnel.
The frameworks contain the exact same five stages, but the order is shuffled to reflect a different strategic priority:
In the RARRA model, Acquisition is deliberately moved to the end. The focus shifts from ‘how do we get more users?’ to ‘how do we create an amazing experience for our current users that keeps them coming back and encourages them to spread the word?’ This retention-first approach ensures you have a solid foundation before you pour fuel on the fire.
The RARRA framework can be particularly valuable in specific scenarios:
The AARRR framework is more than just a set of ‘pirate metrics’; it is a philosophy for building a customer-centric, data-driven business. It provides a clear, logical structure for analyzing the entire customer journey, from the first touchpoint to the final dollar. By breaking down the complex process of growth into five manageable stages—Acquisition, Activation, Retention, Referral, and Revenue—it empowers teams to identify their biggest challenges and focus their efforts where they will have the greatest impact.
Implementing this framework forces you to move beyond vanity metrics and concentrate on the actions and behaviors that truly drive sustainable success. It creates a common language for marketing, product, sales, and leadership, aligning everyone around the shared goal of creating value for the customer. Whether you use the classic AARRR model or adopt the retention-first RARRA approach, the underlying principle is the same: measure what matters, learn from your users, and iterate relentlessly. In the ever-changing digital world, this systematic approach to understanding and optimizing the customer lifecycle is the most reliable map to long-term growth.