


Google’s approach to search engine optimization has evolved, shifting from a primary focus on content to a more holistic measure of website quality. This evolution places a significant emphasis on user experience (UX), with Core Web Vitals at its center. Core Web Vitals are a specific set of metrics Google uses to evaluate a site’s ability to deliver a positive, seamless user experience. Consequently, understanding and optimizing for these vitals has become a fundamental component of modern SEO strategy, not just a niche technical task.
These vitals are not abstract numbers; they represent real-world user interactions by measuring how quickly a page loads, how soon a user can interact with it, and how stable the content is during the loading process. By quantifying these aspects of the user journey, Google can better assess which pages offer a superior experience. A site that loads quickly and feels responsive is more likely to retain visitors, reduce bounce rates, and encourage conversions—all strong indicators of a high-quality website that deserves to rank well.
For years, the link between user experience and SEO has grown stronger. Search engines aim to provide the most relevant, highest-quality results. While this was once determined primarily by keywords and backlinks, Google now recognizes that great content can be undermined by a frustrating user experience. A slow, unstable, or unresponsive website can cause users to abandon the page and return to the search results—a behavior known as “pogo-sticking,” which signals to Google that the result was unsatisfactory.
By directly measuring aspects of UX, Core Web Vitals provide a standardized method for Google to evaluate this crucial element of page quality. A good user experience correlates with higher engagement metrics. Users are more likely to spend more time on a fast, responsive site, view more pages, and ultimately convert. These positive engagement signals reinforce Google’s assessment that your page is a valuable result, which can contribute to improved search rankings over time. In essence, optimizing for users is optimizing for Google.
The Page Experience update, which began rolling out in 2021, officially integrated Core Web Vitals into Google’s ranking algorithm. This update combines the three Core Web Vitals—Largest Contentful Paint (LCP), Interaction to Next Paint (INP), and Cumulative Layout Shift (CLS)—with several other page experience signals. These other signals include:
The introduction of the Page Experience update solidified the importance of technical SEO and web performance. While relevant, high-quality content remains the most critical ranking factor, the page with a superior page experience may receive a ranking boost when multiple pages offer similar content. This makes Core Web Vitals a potential tie-breaker in competitive search results, giving well-optimized sites an edge over slower competitors.
The benefits of optimizing Core Web Vitals extend far beyond SEO, directly impacting your business’s bottom line. A slow and frustrating user experience can deter potential customers and harm your brand’s reputation. Conversely, a fast, seamless experience is proven to improve key business metrics.
Numerous studies demonstrate this connection. Research shows that even a one-second delay in page load time can cause a significant drop in conversions. A faster website leads to lower bounce rates because users are less likely to leave in frustration. It also increases engagement, with visitors often viewing more pages per session. For e-commerce sites, this translates to more product views and a higher likelihood of purchase. For publishers, it means more ad impressions and greater reader loyalty. Investing in Core Web Vitals optimization is an investment in both customer satisfaction and business growth.
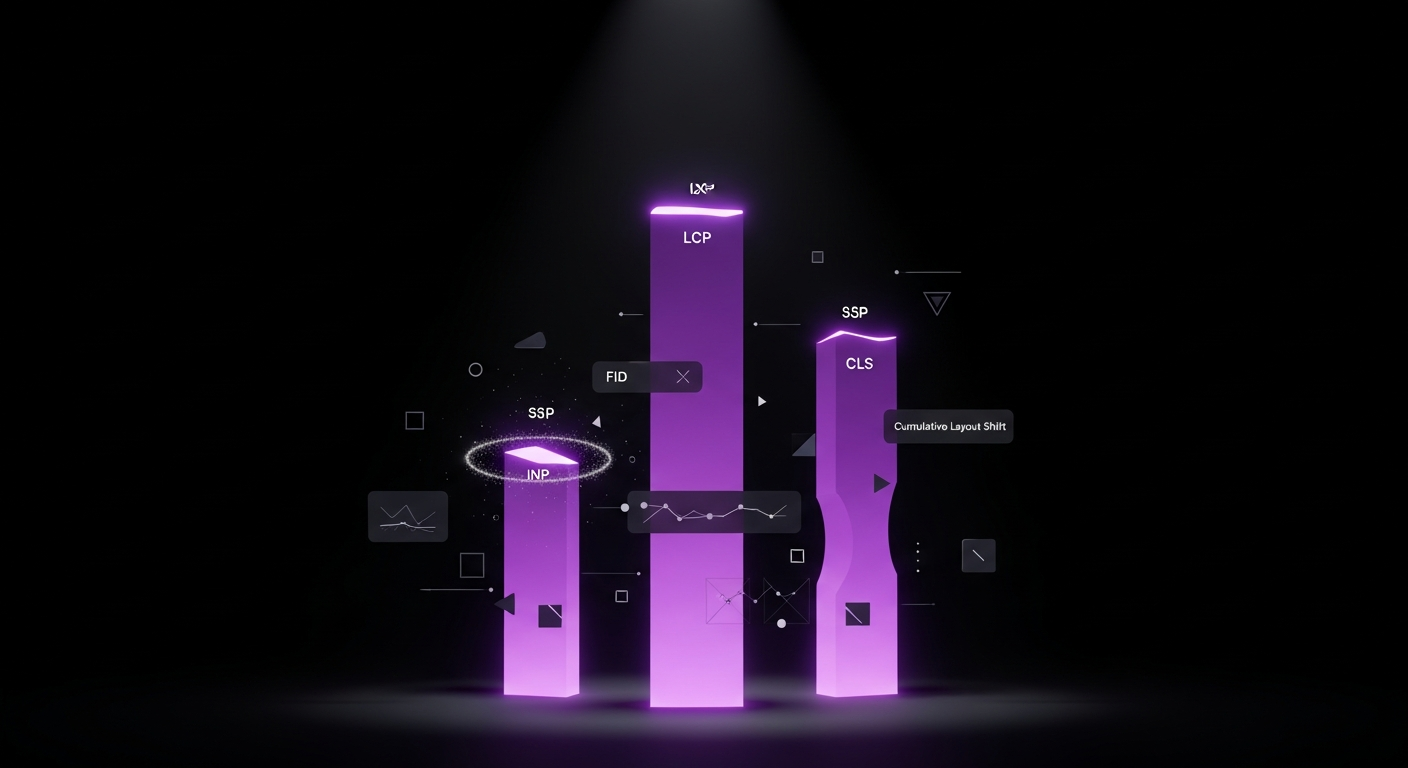
To effectively optimize Core Web Vitals, you must first understand what each metric represents. Google has chosen these three specific pillars—loading, interactivity, and visual stability—because they capture the most critical aspects of a user’s initial experience with a webpage. Mastering these metrics is key to passing the Core Web Vitals assessment and providing a superior user experience.
Largest Contentful Paint (LCP) is the metric that measures perceived loading speed. It marks the point in the page load timeline when the main content has likely loaded. Specifically, LCP reports the render time of the largest image or text block visible within the viewport, relative to when the page first started loading.
The LCP element can vary. It is often a hero image, a poster image for a video, a large heading (like an H1 tag), or a substantial block of text. A fast LCP helps reassure the user that the page is useful and loading correctly. To provide a good user experience, Google recommends that sites strive to have an LCP of 2.5 seconds or less for at least 75% of page visits.
Interactivity metrics measure a page’s responsiveness to user input. Previously, the primary metric was First Input Delay (FID), which measured the time from a user’s *first* interaction (like a click or tap) to when the browser could begin processing a response. FID was a measure of first-impression responsiveness.
In March 2024, Google replaced FID with a more comprehensive metric: Interaction to Next Paint (INP). While FID only measured the delay of the first interaction, INP assesses overall responsiveness by observing the latency of *all* click, tap, and keyboard interactions during a user’s visit. It then reports the longest interaction duration, ignoring outliers, to provide a more complete picture of the page’s interactivity. A low INP score indicates that the browser’s main thread is not overly busy with tasks like executing JavaScript and can respond quickly to user input, ensuring the interface feels snappy and responsive.
Cumulative Layout Shift (CLS) measures the visual stability of a page, quantifying how much visible content shifts unexpectedly as it loads. If you have ever tried to click a button on a webpage, only to have an ad load above it and push the button down, causing you to click the ad instead, you have experienced a layout shift. CLS is the metric designed to measure that frustrating experience.
These shifts are often caused by images or ads loading without their dimensions being specified, web fonts causing a flash of unstyled or invisible text, or content being dynamically injected above existing content. A low CLS score ensures a pleasant experience where users can interact confidently without elements moving around unexpectedly. Google recommends a CLS score of 0.1 or less.

Before you can optimize your Core Web Vitals, you need to know where you stand. Accurately measuring these metrics is the first step in any performance improvement project. There are two primary types of data you will encounter: Lab Data and Field Data. Understanding the difference and knowing which tools to use for each is crucial for a complete performance picture.
Lab data is performance data collected within a controlled environment using a predefined set of network and device conditions. It is a synthetic test that simulates how a user *might* experience your page. This type of data is incredibly useful for debugging performance issues during development because the results are consistent and reproducible.
The two main tools for collecting lab data are Google Lighthouse and Chrome DevTools.
Lab data is ideal for identifying potential problems and testing fixes before deploying them to your live site. However, it does not capture the full range of real-world user experiences.
Field data, also known as Real User Monitoring (RUM), is performance data collected from actual users visiting your website. Sourced from the Chrome User Experience (CrUX) Report—a public dataset from opted-in Chrome users—this is the data Google uses as a ranking signal. This makes field data the ultimate source of truth for your Core Web Vitals performance.
Field data reflects the diverse devices, network conditions, and locations of your actual audience. The primary tool for accessing this data is Google PageSpeed Insights. When you enter a URL, PageSpeed Insights provides two main sections: one for field data (if your site has enough traffic to be in the CrUX report) and one for lab data. The field data shows your LCP, INP, and CLS scores aggregated over the previous 28-day collection period.
| Feature | Lab Data | Field Data (RUM) |
|---|---|---|
| Source | Simulated environment with consistent conditions | Real user measurements from the Chrome User Experience (CrUX) Report |
| Tools | Google Lighthouse, Chrome DevTools | PageSpeed Insights, Google Search Console, CrUX Dashboard |
| Use Case | Debugging issues, testing changes before deployment | Monitoring real-world performance, what Google uses for ranking |
| Consistency | Highly consistent and reproducible | Varies based on users’ devices, networks, and locations |
While PageSpeed Insights is excellent for checking individual URLs, Google Search Console (GSC) provides a site-wide overview of your Core Web Vitals performance over time. The Core Web Vitals report in GSC groups your website’s URLs into three categories based on CrUX field data: “Poor,” “Needs improvement,” and “Good.”
This report is invaluable for identifying systemic issues. For example, if many URLs are flagged as “Poor” for LCP, it likely points to a template-level problem, such as an unoptimized hero image on all your blog posts. You can drill down into each issue to see example URLs, allowing you to diagnose the problem, implement a fix, and then use GSC’s “Validate Fix” feature to ask Google to recrawl and reassess your pages. Monitoring this report regularly is essential for maintaining good Core Web Vitals health.

A poor Largest Contentful Paint (LCP) score is one of the most common performance issues websites face. It directly impacts a user’s perception of speed, and a slow LCP can lead to high bounce rates. Optimizing LCP requires a multi-faceted approach, from improving your server’s response time to ensuring the largest content elements are delivered to the browser as efficiently as possible.
The first step is to identify which element on the page is being measured as the LCP. You cannot fix the problem if you do not know what it is. The easiest way to do this is with Google PageSpeed Insights or the Lighthouse report in Chrome DevTools. In the “Diagnostics” section of the report, you will find an entry for “Largest Contentful Paint element.” This shows the specific HTML element—usually an `` tag or a text block—that is causing the LCP measurement. Once you know the element, you can focus your optimization efforts where they will have the most impact.
Before the browser can render your page, it must receive the first byte of information from your server. The time this takes is called Time to First Byte (TTFB). A slow TTFB will directly delay every other loading metric, including LCP. To improve your TTFB, consider the following:
Render-blocking resources are files, typically CSS and JavaScript, that must be downloaded, parsed, and executed before the browser can render the page’s visible content. If these files are large or numerous, they can significantly delay LCP. To mitigate this:
Because the LCP element is often an image, optimizing media files is critical. Large, unoptimized images are a primary cause of slow LCP. Follow these best practices:

A fast-loading site is only one part of the user experience. When a user clicks a button and the page fails to respond quickly, it creates immense frustration. This delayed response is what Interaction to Next Paint (INP) measures. A poor INP score is almost always caused by a busy main thread, typically due to excessive or inefficient JavaScript execution. Optimizing INP involves freeing up the main thread so it can respond to user input instantly.
The browser’s main thread can only do one thing at a time. If it is busy executing a large piece of JavaScript (a “long task”), it cannot respond to user interactions like clicks or taps. A long task is defined as any piece of code that blocks the main thread for more than 50 milliseconds. You can use the Performance panel in Chrome DevTools to identify these tasks, which are marked with a small red triangle.
The solution is to break these long tasks into smaller, asynchronous chunks. Instead of one monolithic script that runs for 200ms, you can split it into four smaller tasks that each run for under 50ms. This can be done using techniques like `setTimeout` or more modern APIs like `requestIdleCallback`, which schedules work to be done during periods when the browser is idle. This gives the browser opportunities to process user input between the smaller tasks, dramatically improving responsiveness.
The most direct way to improve INP is to reduce the total amount of JavaScript that needs to be executed. The less code the browser has to process, the faster it will be. Consider these strategies:
Third-party scripts for analytics, advertising, customer support widgets, and social media feeds are a common source of performance issues. Often unoptimized, these scripts can execute long tasks that block the main thread, making it crucial to audit their impact:
For particularly heavy or complex JavaScript computations, you can move them off the main thread entirely using Web Workers. A Web Worker runs a script in a separate background thread. This allows you to perform intensive tasks—like processing data, running complex calculations, or managing a real-time data connection—without ever blocking the main thread. The main thread remains free to handle user interface updates and respond to user interactions, ensuring a smooth and responsive experience. While more complex to implement, Web Workers are a powerful tool for solving the most stubborn INP issues.

Cumulative Layout Shift (CLS) is a measure of how visually stable a page is during loading. A low CLS score means the page layout is predictable and does not jump around, providing a more pleasant and less frustrating user experience. Most CLS issues stem from elements being added to the page or resizing after the initial layout is established. Fortunately, these problems are often straightforward to fix with good development practices.
The most common cause of layout shifts is images and videos loading without their dimensions specified. When the browser encounters an `` or `
Modern browsers use these attributes to calculate an aspect ratio and reserve the correct amount of space in the layout before the media file has even downloaded. This prevents the layout shift entirely. You can still make your images responsive with CSS (`width: 100%; height: auto;`), as the browser will use the HTML attributes for the initial space reservation.
Similar to images, other types of content that load asynchronously—such as ads, embedded videos (like from YouTube), and other iframes—can cause significant layout shifts. Since these elements often have variable sizes, you cannot always set a fixed width and height. Instead, you should reserve space for them. You can do this by wrapping the ad slot or iframe in a `
Web fonts can also contribute to CLS. When a page uses a custom web font, the browser often renders the text with a fallback system font first. Once the custom font file downloads, the browser swaps it in. If the custom font’s dimensions differ from the fallback’s, this swap can cause the text to reflow and trigger a layout shift, a phenomenon known as Flash of Unstyled Text (FOUT).
To minimize this, you can:
Animations can also cause layout shifts if implemented incorrectly. Animating CSS properties like `width`, `height`, `top`, or `margin` forces the browser to recalculate the page layout on every frame of the animation. This is computationally expensive and can lead to jank and layout shifts. A much better approach is to use the CSS `transform` property for animations. Properties like `transform: scale()`, `transform: translate()`, and `opacity` are handled by the browser’s compositor thread and do not trigger a layout recalculation. This results in much smoother, more performant animations that do not contribute to your CLS score.

Optimizing for Core Web Vitals can seem daunting, but a wide array of tools and services can simplify the process. From WordPress plugins that automate complex tasks to global networks that accelerate content delivery, leveraging the right tools can significantly improve your performance scores and save countless hours of manual work.
For the millions of websites built on WordPress, performance plugins are the first line of defense. These plugins handle many of the most critical optimizations with just a few clicks. They can manage caching, minify files, optimize databases, and implement features like lazy loading.
A Content Delivery Network (CDN) is a fundamental tool for improving loading performance (LCP and TTFB). A CDN is a geographically distributed network of proxy servers that caches your website’s static content (like images, CSS, and JavaScript files) in multiple locations around the world. When a user visits your site, the CDN serves these assets from the server that is physically closest to them.
This drastically reduces network latency, making your site load faster for a global audience. Many CDNs also offer additional performance and security features, such as image optimization, file minification, and DDoS protection. Popular CDN providers include Cloudflare, StackPath, KeyCDN, and Bunny.net. Most modern web hosts offer a simple, one-click integration with a CDN.
While Google’s free tools like Search Console and PageSpeed Insights are excellent for getting started, dedicated Real User Monitoring (RUM) tools offer far more detailed and actionable insights. These services install a small JavaScript snippet on your site to collect performance data from every single user session, providing a much richer dataset than the CrUX report.
With RUM tools, you can segment performance data by country, device type, browser, and more. You can track your Core Web Vitals scores in real-time, set up alerts for performance regressions, and get detailed diagnostic information to pinpoint the exact cause of issues. This level of granularity is invaluable for businesses that depend on their website’s performance. Leading RUM providers include Datadog, New Relic, Sentry, and SpeedCurve.

While LCP, INP, and CLS are the “Core” Web Vitals that directly impact Google’s Page Experience ranking signal, they belong to a larger family of performance metrics. Understanding these other vitals provides a more complete picture of your site’s performance and can help diagnose issues with the core three. They often serve as crucial supplementary or diagnostic metrics.
First Contentful Paint (FCP) measures the time from when the page starts loading to when any part of the page’s content is rendered on the screen. “Content” refers to text, images (including background images), `
Time to Interactive (TTI) is a lab metric that measures the time it takes for a page to become fully interactive. A page is considered fully interactive when it displays useful content (measured by FCP), event handlers are registered for most visible page elements, and the page responds to user interactions within 50 milliseconds. TTI is useful for identifying pages that look ready but are not yet responsive because the main thread is still busy with loading tasks. While INP has largely replaced TTI’s role in measuring interactivity from a user perspective, TTI can still be a helpful diagnostic metric in lab tests.
Total Blocking Time (TBT) is the primary lab metric used to approximate interactivity before a user has had a chance to interact. It measures the total amount of time between First Contentful Paint (FCP) and Time to Interactive (TTI) where the main thread was blocked for long enough to prevent input responsiveness. Any task that takes longer than 50ms is considered a “long task,” and the blocking time is the duration of that task beyond the 50ms threshold. TBT is a strong lab proxy for INP. If you improve your TBT score in a Lighthouse report, you are very likely to improve your INP score for real users.
Core Web Vitals optimization is not a one-time project; it is an ongoing process of monitoring, testing, and refinement. To maintain a high-performing website, you must integrate performance considerations directly into your regular SEO and development workflows. This proactive approach prevents performance regressions and ensures that user experience remains a top priority as your website evolves.
A performance budget is a set of constraints and targets for your website’s performance. It establishes clear guidelines for your team, such as, “Our pages must not exceed these limits.” These budgets can be based on metrics (e.g., “LCP must be under 2.5 seconds”), file sizes (e.g., “Total JavaScript size cannot exceed 170 KB”), or rule counts (e.g., “The Lighthouse performance score must be 90 or above”).
By setting a performance budget, you make performance a shared responsibility. Developers know the targets they need to hit, and designers can make choices about images and features with performance in mind. This helps prevent “performance creep,” where the site gets gradually slower over time as new features and content are added.
While manually running Lighthouse reports is useful for spot-checks, it is not a scalable solution. To catch performance issues before they reach your users, you should automate your performance testing. Tools like Lighthouse CI (Continuous Integration) can be integrated into your development pipeline. You can configure it to run a Lighthouse audit on every new code commit or pull request. If the new code causes a performance metric to drop below your established budget, the build can be failed, and the developer is immediately notified. This creates a safety net that ensures performance standards are consistently met.
As an SEO or developer, it is easy to get excited about technical improvements like reducing TBT by 100ms. However, business stakeholders are more interested in the impact on key performance indicators (KPIs). It is crucial to translate technical wins into business outcomes. Instead of simply reporting an improved LCP score, connect that improvement to a tangible result. For example, you can report: “By optimizing our product images, we improved LCP by 1.2 seconds, which correlated with a 7% increase in add-to-cart conversions and a 4% decrease in bounce rate.” By framing your work in the context of revenue, conversions, and user engagement, you can effectively demonstrate the ROI of performance optimization and secure ongoing support for your efforts.

Navigating the world of Core Web Vitals can be complex. Use this checklist as a quick reference to ensure you are covering the most important optimization tasks for LCP, INP, and CLS. This list summarizes the key actionable insights discussed throughout this guide.